Conversation


|
Adding notes from initial post and updating that with and overall summary. Currently a work in progress, but so far the underlying charting process has been simplified as follows:
Next steps: Ideally, I'd like to standardize chart rendering even further, possibly by extending the functions captured in the chart metadata. Each non-module chart needs the following functions:
In an ideal world ,the charting tab module would look like this: The problem is the renderChart is a little hard. Need to generalize this chunk: I guess something like this might work: But the nested do.call() doesn't seem the best idea. Maybe we can save that inner chunk as an object. Not sure. Will mess with it next week. Making good progress here. The
We can consider moving back to multi-chart export in a future release. Last big steps here are to work on code that allows users to reproduce charts, and then to clean up tests and checks. |
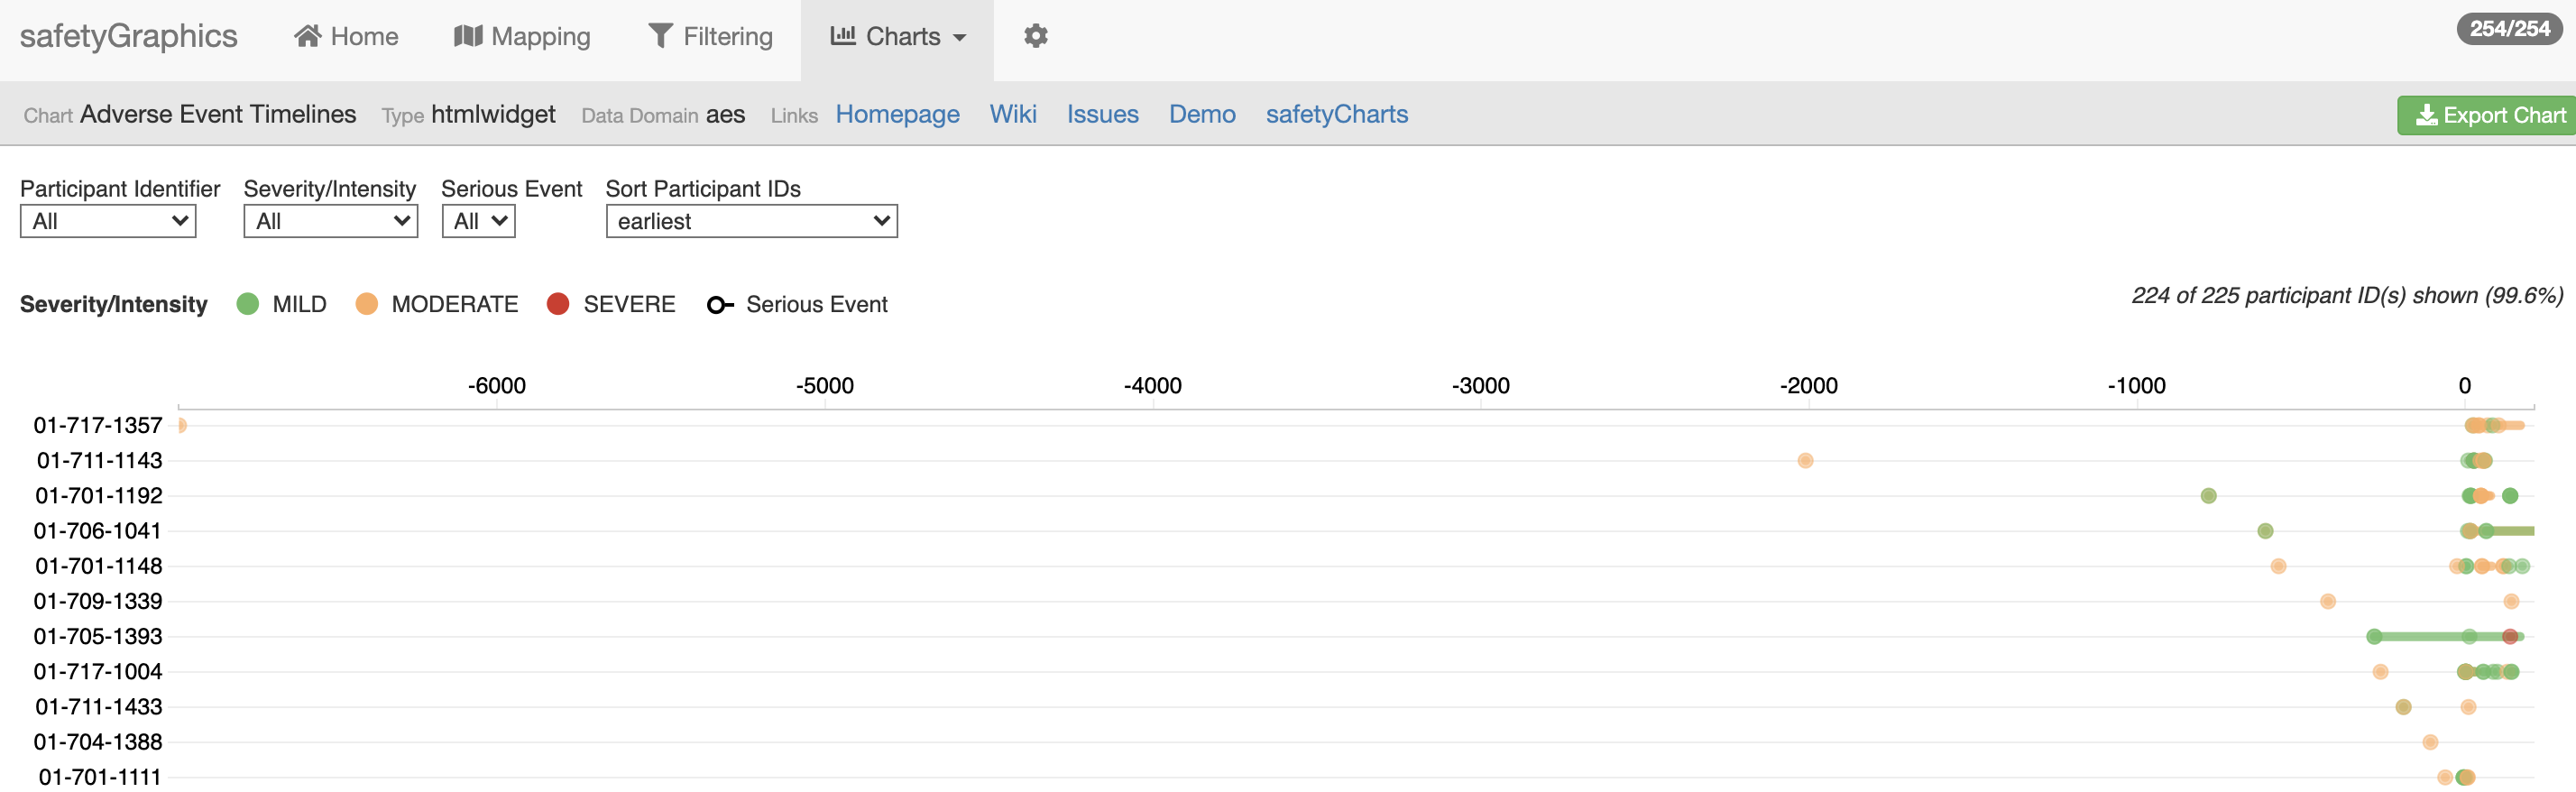
|
OK - I think I'm done! Added a new |

| if(is.null(domain)){ | ||
| return(settingsList) | ||
| }else if(length(domain)>1){ | ||
| return(settingsList) |
|
@xni7 and @samussiah - just fixed a little bug that was preventing the test code from working correctly. Should be good to review now. |

@jwildfire , I am still having the "apply non-function" and grey out issue? |
|
@xni7 Did you use the custom chart object defined here? This runs ok for me now, but it will bomb if you leave in the RTF renderer. Might try to fix that today ... |
|
Yeah it works without the RTF! |
|
Updated the rtf renderer here, and updated the test notes in this PR accordingly. |
|
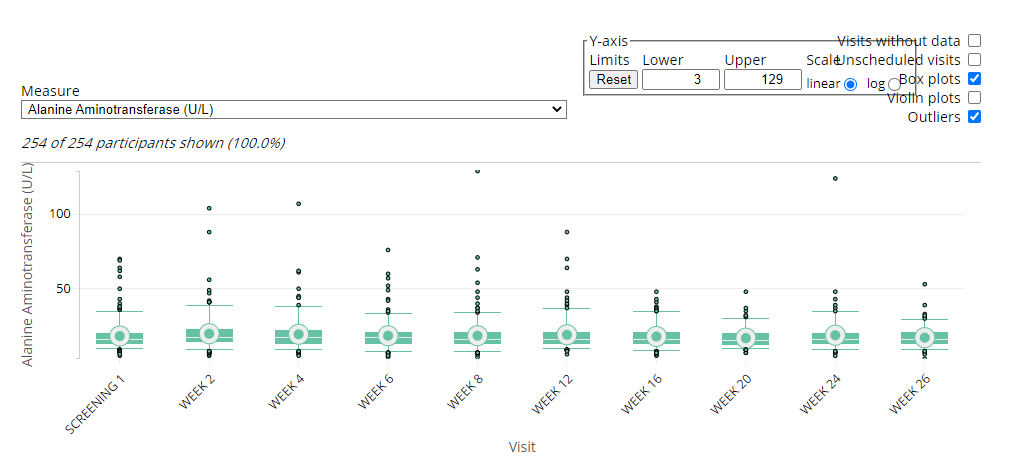
App and code look amazing! checked most charts, all are downloadable. chart is reproducible with the code. Also tested with custom data, it also worked. Just a few minor comments
|
|
Thanks @xni7! Going to go ahead and merge this in a bit. A few notes on your comments below. Feel free to file issues if you think they're needed :)
You mean rendering a table? That's a good idea ... I'll add an issue. Would love to improve the data-handling in the R script as well, but not sure the best way to do that.
This is very likely an issue for the js renderer. Might be able to figure outa work-around, but probably going to leave this until after v2 since it's a safetyCharts tweak.
This is pretty easy. I'll file an issue. |
2 participants


Overview
This PR greatly simplifies the charting workflow in safetyGraphics by moving details from the charting module (
mod_chartTab.R) and putting them in to the chart configuration object (makeChartConfig.Rand friends). This change greatly simplifies the export workflow by allowing many components of the chart objects to be reused.Details
See the posts below for a longer discussion of the approach used here. Here's a quick list of changes:
mod_chartTab.Rto the newmakeChartParams.R. This allows for re-use in the export workflow.makeChartExport.Rto create re-usable R scripts for charts/mappings.makeChartConfigFunctions.Rto deal with binding functions to chart objects including theui,serverandmainfunctions discussed below.makeChartConfigFunctions.Rallowed for a major simplification ofmod_chartTab.Rincluding the deletion ofthe
mod_chartsRenderXXX.Rfamily of functions.mod_chartTab.R)inst/report/safetyGraphicsReport.Rmdusing the new framework. Biggest change is that the report only supports one chart (instead of multiple).Fixes #518 #595
Test Notes
Checkout the branch and use the following script to initialize the app with the test modules and static plots included:
Then test the following: