I would expect that either the lwd in the legend would update automatically with the plot or that specifying lwd in legend() would allow for the update, but instead it changes the character to include a line as if this were a line plot. Big fan of this package by the way.
set.seed(0)
x <- rep(c("A", "B", "C"), each = 20)
y <- runif(60)
gp <- sample(c("X", "Y", "Z"), size = 60, replace = TRUE)
df <- data.frame(x, y, gp)
library(tinyplot)
utils::packageVersion("tinyplot")
#> [1] '0.3.0'
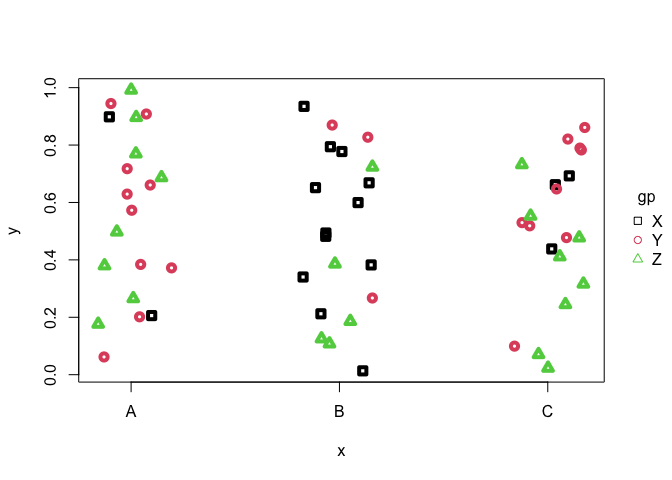
plt(
y ~ x | gp,
data = df,
pch = 0:2,
lwd = 4,
type = type_jitter()
)
plt(
  y ~ x | gp,
  data = df,
  pch = 0:2,
  lwd = 4,
  type = type_jitter(),
  legend = legend(lwd = 4)
)
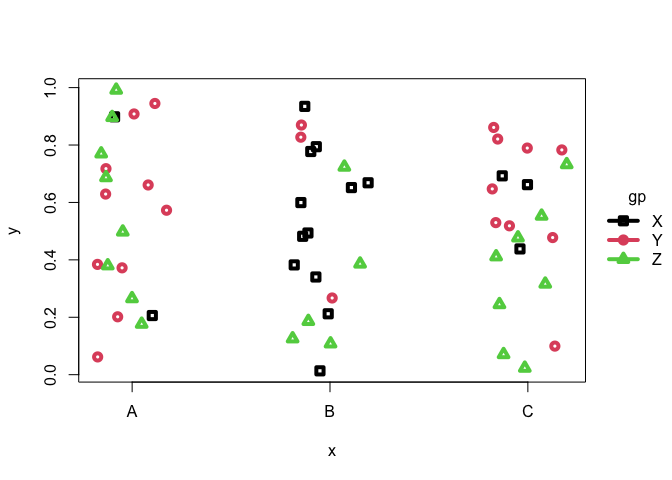
I would expect that either the
lwdin the legend would update automatically with the plot or that specifyinglwdinlegend()would allow for the update, but instead it changes the character to include a line as if this were a line plot. Big fan of this package by the way.