Compare...
library(tinyplot)
tinytheme("basic")

dat = data.frame(
  x = c(1, 2),
  grp = c("A", "B"),
  y = c(10, 11.5),
  lwr = c(8, 9.5),
  upr = c(12, 13.5)
)

plt(y ~ x | grp, ymin = lwr, ymax = upr, data = dat, type = "pointrange") 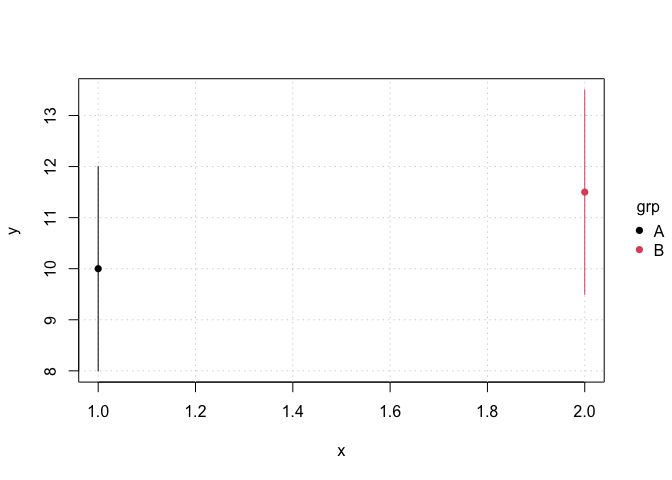
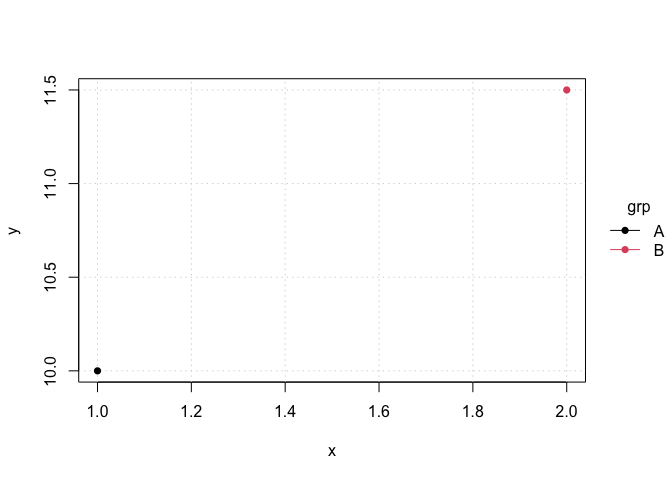
.... versus the legend for the "o" type here:
plt(y ~ x | grp, data = dat, type = "o")
Created on 2025-11-29 with reprex v2.1.1
Compare...
.... versus the legend for the
"o"type here:Created on 2025-11-29 with reprex v2.1.1