Ignore the lack of dodging (that's related to #493), but just ran into this:
library(tinyplot)

models = list(
    "Model A" = lm(mpg ~ cyl, data = mtcars),
    "Model B" = lm(mpg ~ hp + cyl, data = mtcars)
)

results = lapply(names(models), function(m) {
    data.frame(
        model = m,
        term = names(coef(models[[m]])),
        estimate = coef(models[[m]]),
        setNames(data.frame(confint(models[[m]])), c("conf.low", "conf.high"))
    )
})
results = do.call(rbind, results)

tinyplot(estimate ~ term | model,
         ymin = conf.low, ymax = conf.high,
         data = results,
         type = "pointrange",
        #  dodge = 0.1,
         theme = "basic")
tinyplot_add(type = "l")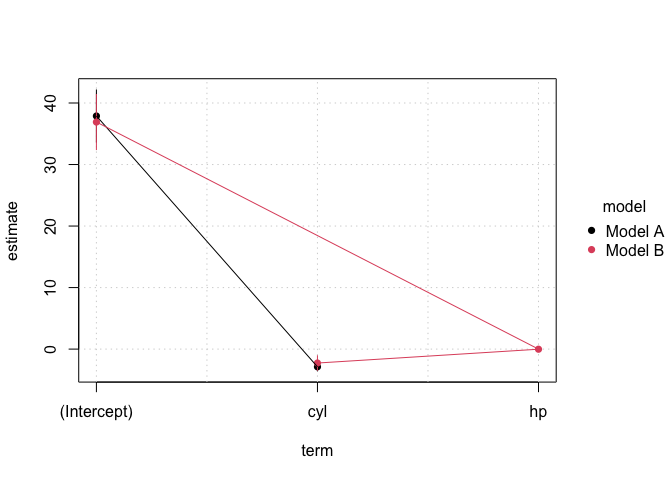
Created on 2025-11-21 with reprex v2.1.1
Should be an easy fix (fingers crossed).
Ignore the lack of dodging (that's related to #493), but just ran into this:
Created on 2025-11-21 with reprex v2.1.1
Should be an easy fix (fingers crossed).