Thanks for this awesome package! It's reignited my love for base-type graphics.
While testing the package, I found a bug / inconsistency / came up with a feature request. I was trying to create horizontal barcharts with labels. Plotting the label positions using tinyplot_add(type = type_points()) works as expected, but plotting the actual labels results in an error. The expected behaviour is for the type_text() to work in the same way as type_points(). Incidentally, it seems that plotting the text alone fails as well.
library(dplyr)
#>
#> Attaching package: 'dplyr'
#> The following objects are masked from 'package:stats':
#>
#> filter, lag
#> The following objects are masked from 'package:base':
#>
#> intersect, setdiff, setequal, union
library(tinyplot)
data(penguins)
percent_labeller <- function(estimate, cutoff = 2) {
out <- round(estimate * 100)
too_small <- out < cutoff
out <- out |> as.character()
out[too_small] <- ""
out
}
penguins <- penguins |> as_tibble()
## Remove missing data for this test
penguins <- penguins |> na.omit()
## Calculate species by islands
e1 <- penguins |>
count(island, species, .drop = FALSE) |>
mutate(p = n / sum(n), .by = island)
## Remove labels for very small or nonexistent groups
e1 <- e1 |> mutate(lab = percent_labeller(p))
## Calculate label positions
e1 <- e1 |>
arrange(island, species) |>
mutate(lab_pos = cumsum(p) - 0.5 * p, .by = island)
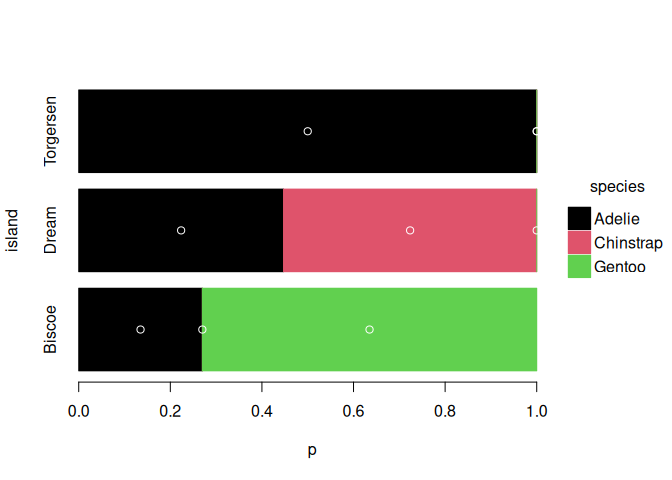
## Plotting the data works
tinyplot(
p ~ island | species,
type = type_barplot(),
data = e1,
flip = TRUE
)
## Adding the label positions as points works
tinyplot_add(
lab_pos ~ island,
type = type_points(),
col = "white"
)
## Adding the labels themselves fails
tinyplot_add(
  lab_pos ~ island,
  type = type_text(labels = e1$lab),
  col = "white"
)
#> Error in Summary.factor(structure(c(1L, 1L, 1L, 2L, 2L, 2L, 3L, 3L, 3L: 'range' not meaningful for factors

## Plotting the labels alone fails as well
tinyplot_add(
  lab_pos ~ island,
  type = type_text(labels = e1$lab),
  col = "white",
  data = e1
)
#> Error in Summary.factor(structure(c(1L, 1L, 1L, 2L, 2L, 2L, 3L, 3L, 3L: 'range' not meaningful for factors
Created on 2025-09-10 with reprex v2.1.1
Thanks for this awesome package! It's reignited my love for base-type graphics.
While testing the package, I found a bug / inconsistency / came up with a feature request. I was trying to create horizontal barcharts with labels. Plotting the label positions using tinyplot_add(type = type_points()) works as expected, but plotting the actual labels results in an error. The expected behaviour is for the type_text() to work in the same way as type_points(). Incidentally, it seems that plotting the text alone fails as well.
Created on 2025-09-10 with reprex v2.1.1