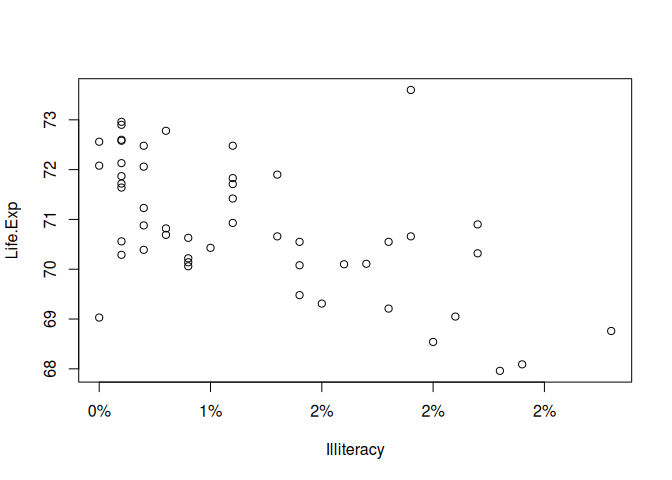
It would good if we could support the equivalent tinylabel functionality/passing that we do for axes (via x/yaxl)...
library(tinyplot)

dat = transform(data.frame(state.x77), Illiteracy = Illiteracy/100)

plt(
  Life.Exp ~ Illiteracy,
  data = dat,
  xaxl = "%"
)
... for legend labels too:
plt(
  Life.Exp ~ Income | Illiteracy,
  data = dat
)
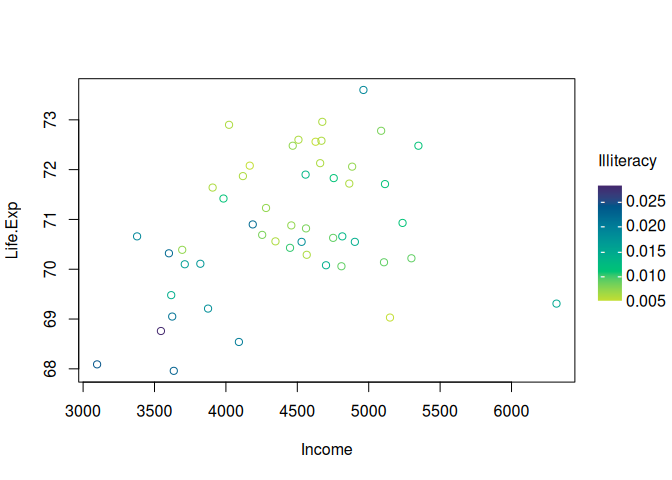
This should be pretty simple to operationalise via an additional draw_legend(..., labeller/format = ...) argument. Users could then pass down from the top level function as plt(..., legend = list(..., labeller/format = ...)).
P.S. You could say the same thing about breaks (c.f. x/yaxb), at least for continuous/gradient legends.
It would good if we could support the equivalent tinylabel functionality/passing that we do for axes (via
x/yaxl)...... for legend labels too:
This should be pretty simple to operationalise via an additional
draw_legend(..., labeller/format = ...)argument. Users could then pass down from the top level function asplt(..., legend = list(..., labeller/format = ...)).P.S. You could say the same thing about breaks (c.f.
x/yaxb), at least for continuous/gradient legends.