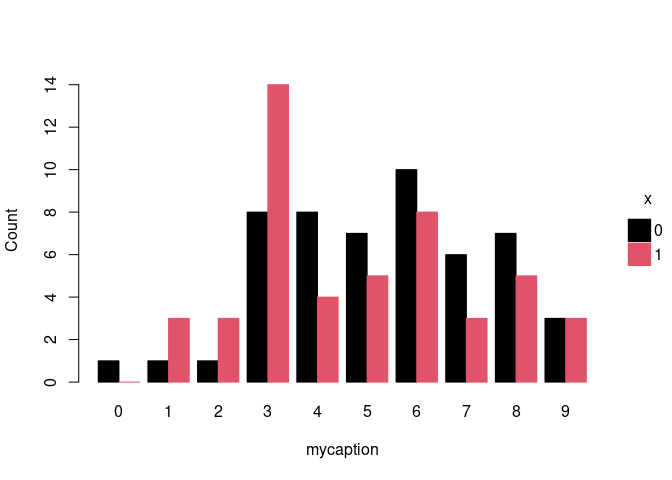
The y-axis label displays on the x-axis instead. This does not depend on the beside argument.
set.seed(2025)
n <- 100L
x <- factor(sample(0:1, size = n, replace = TRUE))
y <- rpois(n, 5)
tinyplot::plt(~ y | x, type = "barplot", beside = TRUE, ylab = "mycaption")
Created on 2025-06-06 with reprex v2.1.1
The y-axis label displays on the x-axis instead. This does not depend on the
besideargument.Created on 2025-06-06 with reprex v2.1.1