It would be nice if we could support nested grouping. (Or, put differently, allow colours to vary/repeat across units.) This would mostly be useful for line plots where we want to avoid joining the end of one line with the start of another. The idea is similar to how ggplot2 allows you to specific aes(col = var1, group = var2) separately.
Here is an illustration using the following dataset. The setting is a difference-in-differences research design with staggered treatment. So we have treatment cohorts (first_treat) superimposed on individual units (id).
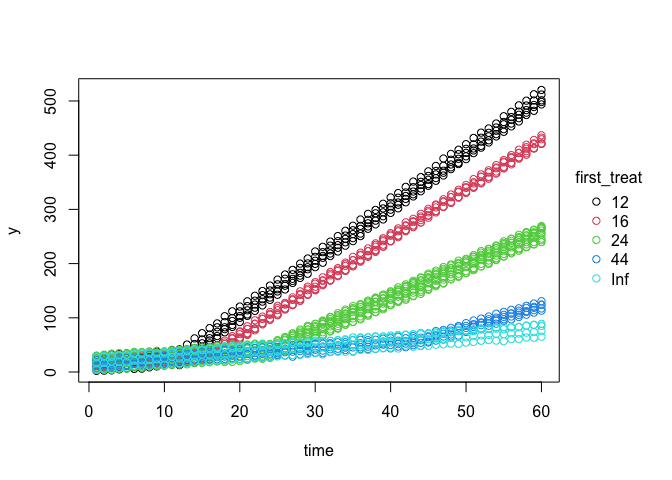
- First, points. (Fine.)
plot2(y ~ time | first_treat, dat)
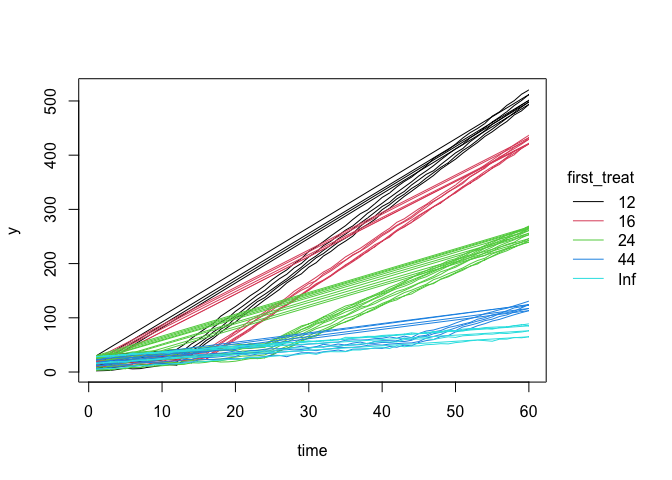
- Second, lines. (Not fine, because we have lines rejoining across units in the same cohort.)
plot2(y ~ time | first_treat, dat, type = "l")
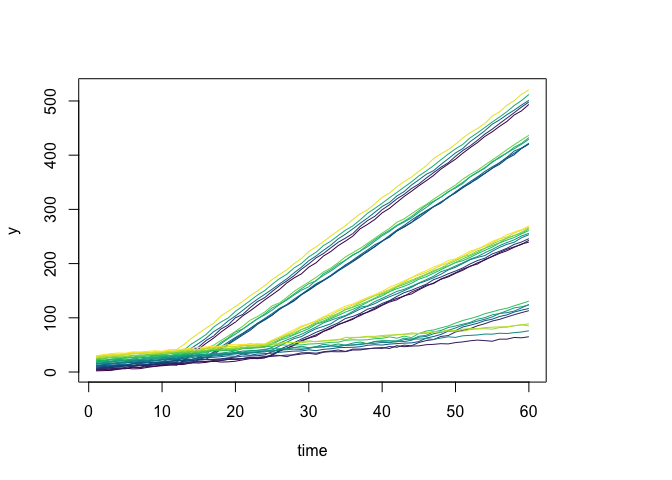
Of course, we could group (colour) by the individual IDs. This stops the rejoining, but means that we lose the colouring by treatment group (which is the interesting thing from a causal inference perspective).
plot2(y ~ time | id, dat, type = "l", legend = FALSE)
I don't have a solution right now, but it probably requires a new argument like bycol. On the formula side, we could potentially represent this via a / nesting interaction. So the call would become plot2(y ~ time | first_treat / id, dat, type = "l"), i.e. units are nested within first treatment cohorts.
It would be nice if we could support nested grouping. (Or, put differently, allow colours to vary/repeat across units.) This would mostly be useful for line plots where we want to avoid joining the end of one line with the start of another. The idea is similar to how ggplot2 allows you to specific
aes(col = var1, group = var2)separately.Here is an illustration using the following dataset. The setting is a difference-in-differences research design with staggered treatment. So we have treatment cohorts (
first_treat) superimposed on individual units (id).Of course, we could group (colour) by the individual IDs. This stops the rejoining, but means that we lose the colouring by treatment group (which is the interesting thing from a causal inference perspective).
I don't have a solution right now, but it probably requires a new argument like
bycol. On the formula side, we could potentially represent this via a/nesting interaction. So the call would becomeplot2(y ~ time | first_treat / id, dat, type = "l"), i.e. units are nested within first treatment cohorts.