Mostly for bubble charts. You can imagine the background colour below being assigned by group (as opposed to random recycling here).
with(
    data.frame(state.x77),
    {
        symbols(
            x = Income, y = Life.Exp,
            circ = sqrt(Population / pi),
            inches = .25,
            fg = "white",
            bg = palette.colors(n = 4, alpha = 0.5)[-1],
            main = "Life expectancy among US states (1977)"
        )
    }
)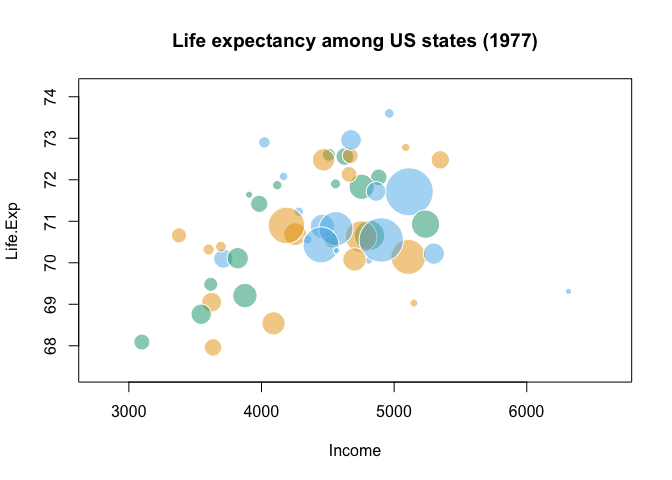
Created on 2023-04-17 with reprex v2.0.2
Mostly for bubble charts. You can imagine the background colour below being assigned by group (as opposed to random recycling here).
with( data.frame(state.x77), { symbols( x = Income, y = Life.Exp, circ = sqrt(Population / pi), inches = .25, fg = "white", bg = palette.colors(n = 4, alpha = 0.5)[-1], main = "Life expectancy among US states (1977)" ) } )Created on 2023-04-17 with reprex v2.0.2