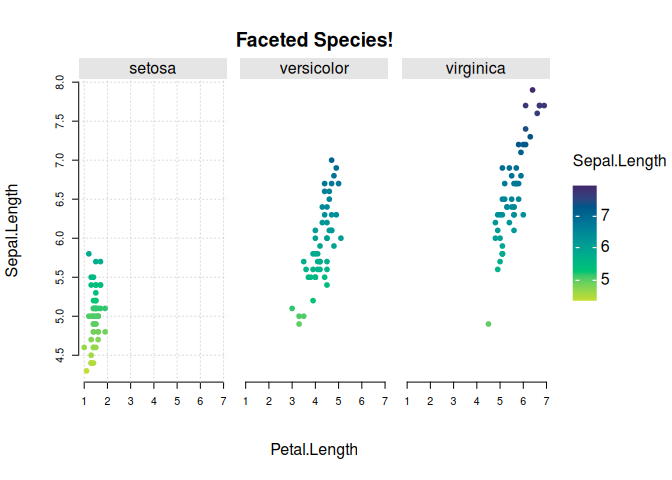
Specifically, it only seems to be working for the first facet. Tweaked example from the README, where we use grid = grid() instead of grid = TRUE.
library(tinyplot)
plt(
  Sepal.Length ~ Petal.Length | Sepal.Length, data = iris,
  facet = ~Species, facet.args = list(bg = "grey90"),
  pch = 19,
  main = "Faceted Species!",
  grid = grid(), # <--
  frame = FALSE
)
Created on 2024-08-04 with reprex v2.1.1
Specifically, it only seems to be working for the first facet. Tweaked example from the README, where we use
grid = grid()instead ofgrid = TRUE.Created on 2024-08-04 with reprex v2.1.1