cvapipe steps
After getting the data loaded to your staging/loaddata folder, see below how to run each step of cvapipe_analysis. Keep in mind that these steps are controlled via a configuration file that can be found in your staging folder. To learn more about the configuration file and the parameters in it, please see this.
Click here to read more about how to adjust the configuration file.
This step will extract single cell features, including the spherical harmonics coefficients as specified in the configuration file.
python computefeatures run --staging /path/to/staging/folderThe preprocessing included mitotic cells removal and outlier detection. These filtering can be turn off in the configuration file.
python preprocessing run --staging /path/to/staging/folderThis step will use the spherical harmonics coefficients to compute the shape space of the input dataset. Shape space details like the number of shape modes and map points, can be changed in the configuration file.
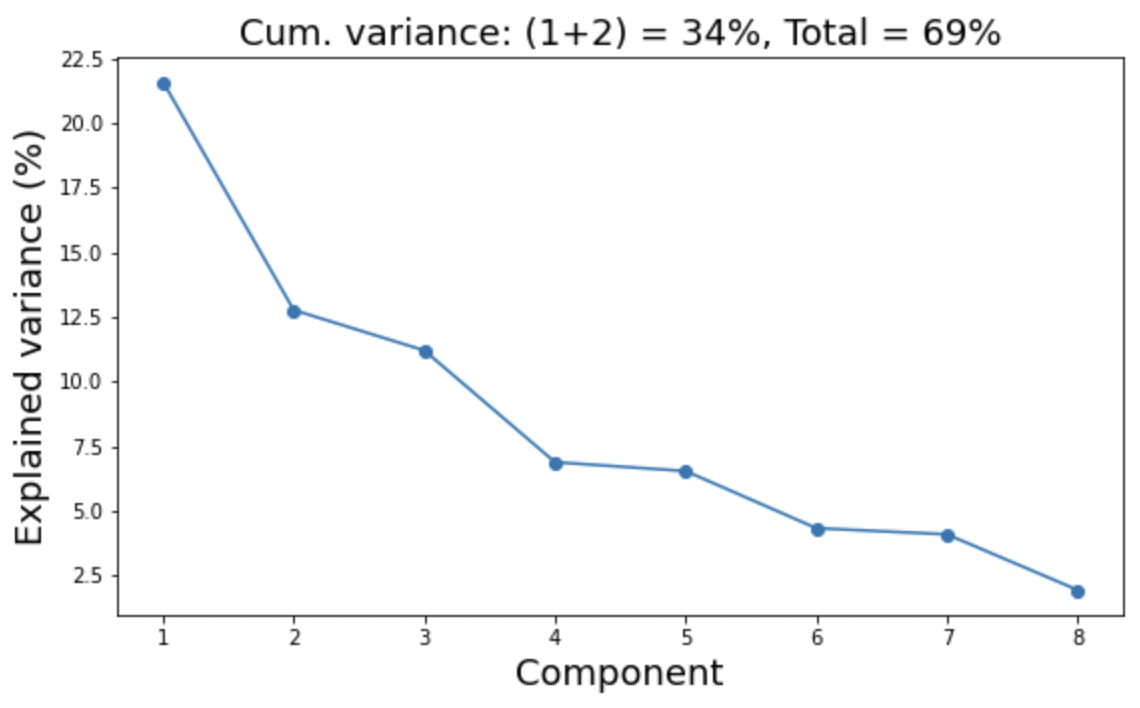
python shapemode run --staging /path/to/staging/folderFolder staging/shapemdoe/pca will contain a plot for the explained variance by each principal component like this:
A table with feature importance like this:
Explained variance NUC_MEM_PC1=21.6%
                        NUC_MEM_PC1  NUC_MEM_aPC1  NUC_MEM_cPC1
features
MEM_shcoeffs_L2M0C_lcc     5.641941      5.641941     16.811509
MEM_shcoeffs_L0M0C_lcc     3.924941      3.924941     11.695298
NUC_shcoeffs_L2M0C_lcc     3.483849      3.483849     10.380958
MEM_shcoeffs_L4M0C_lcc    -3.435271      3.435271     10.236208
NUC_shcoeffs_L0M0C_lcc     3.018635      3.018635      8.994742

Explained variance NUC_MEM_PC2=12.8%
                        NUC_MEM_PC2  NUC_MEM_aPC2  NUC_MEM_cPC2
features
MEM_shcoeffs_L0M0C_lcc     5.140302      5.140302     25.072968
NUC_shcoeffs_L0M0C_lcc     3.226166      3.226166     15.736344
MEM_shcoeffs_L2M0C_lcc    -3.204831      3.204831     15.632278
NUC_shcoeffs_L2M0C_lcc    -1.758686      1.758686      8.578385
MEM_shcoeffs_L4M0C_lcc     0.972720      0.972720      4.744657
and a pairwise correlation plot between each principal component. When running this on custom datasets, we suggest adjusting the removal percentage of cells (removal_pct) in the configuration file if you observe outliers in this plot.
The folder staging/avgshape contains animated GIFs for each shape mode along each of the three dimensions. These is also provided as VTK files that can be loaded in 3D viz softwares like Paraview. so you can interpret what the shape modes are. The GIFs are also combined together in a TIF file named combined.tif that can be loaded in ImageJ, for example.
This step will create the PILR representation for each cell.
python parameterization run --staging /path/to/staging/folderThis step will generate the average PILRs and average morphed cells per structure.
python aggregation run --staging /path/to/staging/folderResults are stored in the folders staging/aggregation/aggmorph/ and staging/aggregation/repsagg/. Example of results files in the first folder is avg-STR-ATP2A2-NUC_MEM_PC6-3.tif, representing the average morphed cell of ATP2A2 in shape mode 3 and map point 3.
This step will compute correlations between all pairs of cells in the same region of shape space.
python correlation run --staging /path/to/staging/folderCorrelation values are stored as a matrix in the folder staging/correlation/values/ as TIF files. The element (i,j) of this matrix corresponds to the correlation between PILRs of cells i and j. These cells are specified by their ids in CSV files. For example, the file avg-STR-NUC_MEM_PC1-5.tif contains the correlation between all cells that fall into map point bin 5 of shape mode 1. The corresponding cell ids are specified in the file avg-STR-NUC_MEM_PC1-5.csv.
This step computed stereotypy values per structure.
python stereotypy run --staging /path/to/staging/folderThis step computed concordance values per pairs of structures.
python concordance run --staging /path/to/staging/folder